This post is also available in:
 Español
  Português
ISO 4120 is the international standard describing the methodology known as the triangle test, designed to determine whether or not a perceptible sensory difference exists between two products or variants of the same product.

This standard is used by R&D teams, quality control departments, and sensory laboratories to provide objective evidence of changes in formulation, process, packaging, or storage, as well as for evaluator training and monitoring.

The most recent version is the 2021 edition, which replaces the previous 2004 edition and incorporates, among other improvements, a broader scope of application beyond the food industry and additional guidance on psychometric models such as the Thurstonian model.
Scope and Limitations
The triangle test is a forced-choice procedure applicable both when the sensory difference involves a single attribute and when it affects several attributes simultaneously; however, the test does not quantify the size or direction of the difference, nor does it identify which attribute causes it, so it should be supplemented with descriptive tests when characterizing the changes is required.
The test offers greater statistical efficiency compared to other discrimination procedures such as the duo-trio, but has limitations with products that generate strong carryover or persistent flavors that interfere between replicates.
It is only applicable when the products are reasonably homogeneous, and its interpretation requires careful attention to evaluator selection and number, and to the statistical model used.
What Is the Thurstonian Model?
This model was originally proposed by L. L. Thurstone in the 1920s to explain preference and discrimination judgments, and was later adapted by sensory researchers to interpret tests such as ISO 4120 (triangle test).
The Thurstonian model is a statistical and psychometric approach used in sensory analysis (and experimental psychology) to describe how people perceive and discriminate differences between stimuli, such as flavors, odors, or textures.
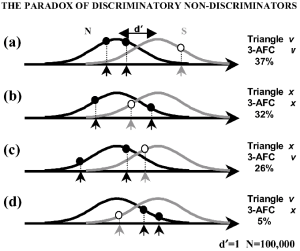
Rather than treating responses as simple correct or incorrect answers (as traditional binomial analysis does), the Thurstonian model assumes that each stimulus generates an internal distribution of sensations — a kind of “cloud” of perceptions — along a psychological continuum.
When an evaluator compares two products, they do not perceive exact values, but rather intensities with some internal variability. If the two distributions (of A and B) overlap greatly, the person will have difficulty distinguishing them; if they are further apart, the probability of correctly identifying the different sample increases.
Test Design and Execution
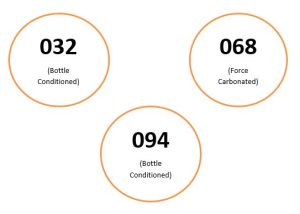
Practical execution of a triangle test according to ISO 4120 requires preparing triads consisting of two identical samples and one different sample, presenting the three samples randomly and in a balanced manner to minimize systematic effects, and asking each evaluator to identify the sample they perceive as different.
The standard recommends using the six possible presentation sequences of A and B to balance the order and suggests distributing them randomly among evaluators; service conditions must be homogeneous, including sample temperature and volume, and evaluators must receive uniform instructions on whether to swallow or spit and on the non-disclosure of information that could bias the evaluation.
Evaluator selection and qualification must be in line with ISO 8586 and adjusted to the objective of the test, recognizing that experience and familiarity with the product directly influence the sensitivity of the test.
For difference tests, it is practical to have between 24 and 30 evaluators, and for similarity tests (no significant difference), the required sensitivity requires approximately twice as many evaluators, although Table A.3 of the standard provides precise values based on desired sensitivity parameters.

| Number of judges (n) | Minimum correct (α = 0.05) | Minimum correct (α = 0.01) |
|---|---|---|
| 6 | 5 | 6 |
| 8 | 6 | 7 |
| 10 | 7 | 8 |
| 12 | 8 | 9 |
| 15 | 9 | 10 |
| 18 | 10 | 12 |
| 20 | 11 | 13 |
| 24 | 13 | 15 |
| 30 | 15 | 17 |
| 36 | 18 | 20 |
| 40 | 19 | 21 |
| 50 | 23 | 26 |
Note: The values provided were calculated using the binomial distribution for p = 1/3 and correspond to the minimum number of correct responses such that the probability of obtaining that number or more by chance is ≤ α. The ISO 4120:2021 standard presents the official table (Annex A); use this simplified version for illustrations and web entries and consult the standard for formal use.
Statistics and Psychometrics
Classical analysis of the triangle test is based on the “guessing” model, which takes into account the probability of a correct answer by simple conjecture; however, the 2021 edition of the standard incorporates additional guidance on the use of the Thurstonian model, which allows modeling the underlying sensitivity distribution among evaluators and provides estimates of the proportion of the population capable of distinguishing the samples.
This approach can offer a richer interpretation than a simple binomial comparison, especially when seeking to estimate the fraction of the population with discriminative capacity or to calculate confidence intervals for that fraction.
It is important to define the type I error (α) and type II error (β) levels in advance and to design the sample size accordingly, using the tables or procedures recommended by the standard to ensure the required sensitivity.
Practical Applied Example
A beverage manufacturer wishes to assess whether a change in raw material introduces a perceptible difference in flavor; a series of triads is prepared where each triad contains two samples of the reference formulation and one of the new formulation, and the six sequences are distributed among groups of evaluators to ensure balance in the order of presentation.
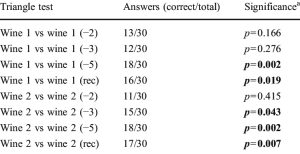
Sessions are conducted under controlled conditions, the number of correct responses is recorded and compared against the critical table for the number of selected evaluators, or a Thurstonian model is applied to estimate the proportion of consumers capable of detecting the difference.
If the number of correct responses exceeds the critical threshold, a significant sensory difference is concluded and further descriptive attribute analysis is conducted to identify the cause.
This design illustrates how the triangle test functions as a rapid and statistically sound filter for detecting changes, but does not replace descriptive methods when the intention is to characterize the nature of the change.
Practical Recommendations
Before running a triangle test, the following conditions must be established:
- Clarify the objective (difference versus similarity) and plan the appropriate sample size and significance level; ensure uniformity in service conditions and evaluator instructions, and employ sequence randomization and balancing to minimize order biases.
- Avoid the triangle test when the product has prolonged organoleptic retention that causes carryover; if this is unavoidable, consider alternative tests or protocols with longer rinse intervals between samples.
- Include pilot trials to estimate the expected sensitivity and variability among evaluators, and supplement discrimination with descriptive or preference analysis when understanding the direction and magnitude of the change is required.
- Perform statistical analysis with critical tables or psychometric models as appropriate, and document all methodological assumptions and decisions to ensure reproducibility and traceability.
Good Practices and Transparency
The report of a triangle test must clearly specify the version of the standard used, the objective of the test, the description of the samples (including batch and handling), the number and qualification of the evaluators, the presentation conditions, the randomization and sequencing balance, the statistical analysis methodology chosen and the α and β values used, as well as the numerical result (number of correct responses) and the decision made based on the critical table or the model applied.
When the Thurstonian model is used, include the model assumptions and, where appropriate, the confidence interval for the proportion of the population capable of distinguishing the samples. This transparency facilitates interpretation by third parties and appropriate decision-making in R&D or quality control.
Overall Conclusions
ISO 4120 offers a robust and well-documented procedure for detecting sensory differences through the triangle test; its value lies in statistical efficiency and operational simplicity for identifying whether a change in formulation or process produces a perceptible effect.
To maximize its value, its use must be accompanied by careful experimental design, appropriate evaluator selection, strict control of service conditions and appropriate statistical analysis, and when understanding the nature of the change is required, it is advisable to supplement discrimination with descriptive methods.
Adopting the recommendations and documenting the entire process will allow sensory results to be converted into science-based product decisions.
References
International Organization for Standardization. (2021). ISO 4120:2021 Sensory analysis — Methodology — Triangle test. ISO. https://www.iso.org/standard/80783.html

Recommended
- Scientists identify umami flavor peptides that give body to Lager beers
- What is gushing in beer? Causes and most common control strategies