This post is also available in:
 Español
 Português
 Français
A glass-bottled beer contains, on average, more microplastics than the same beer in a can, and the main source is the paint on the bottle cap rather than the glass. That is the conclusion of the 2025 study by the French food safety agency ANSES, the most cited of a series of papers that have measured plastic particles in beers from France, Spain, Mexico, the United States, Germany, Ecuador and South Korea.
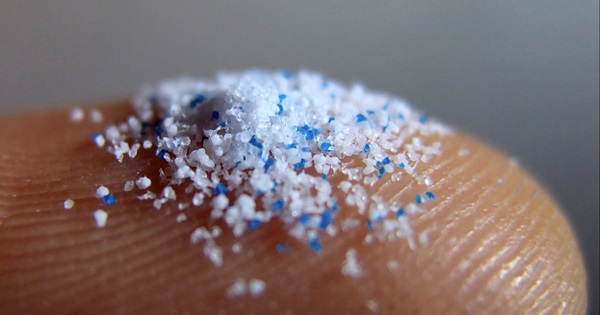
The figures vary widely between countries, from 4 particles per liter in the United States to more than 90 in Spain. Much of that difference lies in how the particles are measured rather than in the beer itself, and understanding that matters as much as the number.

This article brings together what the published studies say, which containers come out worst, where the particles get in and what science knows today about the risk of drinking them.
How Many Microplastics Does Beer Contain in Each Country?
The French paper, authored by Iseline Chaïb and the ANSES food safety laboratory in Boulogne-sur-Mer, analyzed water, soft drinks, beer and wine in different containers. Beer was the most contaminated beverage, with an average of 82.9 particles per liter, compared with 2.9 in water and 8.2 in wine.
In Spain, a team from the universities of La Laguna and Valencia measured 73 beverages in 2024 and beer again topped the list. They found an average of 95.5 particles per liter, with enormous dispersion between samples, compared with 7.2 in water.
In western Mexico, a 2026 study analyzed 10 beers from 6 brands and found microplastics in all of them, with an average of 20.6 particles per liter. Canned soft drinks were the most contaminated category in the country, with 36.4.
The United States provides the lowest figure. In 2018, Kosuth, Mason and Wattenberg analyzed 12 brands brewed with water from the Great Lakes and obtained 4.05 particles per liter, almost all of them fibers, with no correlation whatsoever with the tap water of each city.
The pioneers were Liebezeit and Liebezeit in Germany in 2014, with 24 brands and between 12 and 109 fragments per liter. In Ecuador, the first Latin American study measured 47 particles per liter in industrial beer and 32 in craft beer in 2020, and in South Korea the medians were 10 in domestic beer and 7 in imported beer.
Brazil has a 2025 preprint that found microplastics in all 30 beverages analyzed, beer included, with an overall average of 101.89 particles per liter. The abstract does not break out the figure for beer and the paper has not yet passed peer review.
The table summarizes the results by country with the sample size of each study.
| Country and year | Beers analyzed | Result in beer | Source |
|---|---|---|---|
| France, 2025 | 2 brands, 5 types, glass and can | 82.9 ± 13.9 MP/L | Chaïb et al. |
| Spain, 2024 | Part of 73 beverages | 95.5 ± 91.8 MP/L | Socas-Hernández et al. |
| Mexico, 2026 | 10 samples, 6 brands | 20.6 ± 16.7 MP/L | Hernández-Covarrubias et al. |
| United States, 2018 | 12 brands | 4.05 MP/L (0 to 14.3) | Kosuth et al. |
| Germany, 2014 | 24 brands | 12 to 109 fragments/L | Liebezeit and Liebezeit |
| Ecuador, 2020 | 15 samples | 47 industrial, 32 craft MP/L | Diaz-Basantes et al. |
| South Korea, 2023 | Domestic and imported | Medians 10 and 7 MP/L | Pham et al., via Bhowmik 2026 |
Why Do Glass Bottles Come Out Worse Than Cans?
The most counterintuitive finding of the French study is that beverages in glass bottles had on the order of 100 particles per liter, between 5 and 50 times more than the same beverages in plastic packaging or in cans. Glass does not shed plastic, so the explanation had to lie elsewhere.
The researchers observed that most of the particles had the same color and the same composition as the exterior paint of the metal caps. The polyester cluster, which groups PET and alkyd lacquers, dominated in glass containers and reached 95.9 particles per liter in the beers.
To test this, they filled clean glass bottles with filtered water and sealed them with caps under three conditions. Uncleaned, the caps left 287.3 particles per liter; blown with air, 105.8; blown and rinsed with water and ethanol, 86.7.
[math] \dfrac{287.3 – 86.7}{287.3} = 0.698 [/math]
Blowing and rinsing the caps before capping cut contamination by almost 70%. The rinse liquid contained an average of 47.8 yellow particles per cap, the color of the paint.
The hypothesis is that the caps rub against each other during storage and transport and those tiny scuffs release paint. One cheap industrial step, cleaning the caps before use, would be enough to eliminate much of the problem.
Which Type of Beer Has the Most Particles?
The French study measured five types from the two brands analyzed. Amber beers were the most contaminated, with 117.8 particles per liter, and fruit beers the least, with 69.8.
Blond beers gave 78.9, alcohol-free beers 74.8 and alcohol-free fruit beers 94.0. With only two brands, these differences by style are indicative and do not allow generalization.
In terms of shape, 92.7% of the particles in beer were fragments, not fibers. That is the opposite pattern to the 2018 US study, where 98.4% were fibers, and that discrepancy is the first clue that the methods are not measuring the same thing.
Are the Figures Comparable Between Studies?
Not entirely. The review by Bhowmik, Hossain and Saha published in 2026 in the journal Pollutants analyzed 17 beverage studies and concluded that differences in design prevent direct comparisons.
The minimum particle size that each laboratory is able to see changes the result completely. The Spanish study counted particles from 45 to 5,000 microns; the French one detected fragments from 30 microns and the US one relied on dyed fibers visible under the microscope.
Chemical identification also varies. In Ecuador, infrared analysis confirmed only 12% of the counted particles as plastic, and in Spain most were cellulosic, natural or semisynthetic, with polyester as the only common plastic polymer.
Back in 2015, Lachenmeier and his team at the official laboratory in Karlsruhe replicated the method of the German study and concluded that the background contamination of the laboratory itself was so high that it could not distinguish the beers from the blanks. They maintain that those first positives were artifacts.
The French study also received a critical comment in the same journal, signed by Jane Muncke and seven other researchers. They argue that normalizing per liter inflates small containers, that the glass bottles in the study were smaller than their plastic equivalents and that results should be reported per surface area of plastic in contact, as EU Regulation 10/2011 requires.
None of the criticisms denies that there are particles in beer. What they dispute is the ranking of containers and the precision of the numbers.
Where Do Microplastics Get into Beer?
Water seems ruled out as the main source. In the United States there was no correlation between the particles in each beer and those in the tap water of the municipality where it was brewed, with a coefficient of 0.016.

Painted caps are the best-documented candidate for bottled beer. The aluminum can is not in the clear either, since the Spanish study identified phenoxy resin from the interior coating in every can analyzed, a sign of migration from the container.
Inside the brewery, Liebezeit pointed to the filtration stage as a vector, and Muncke’s comment adds the filling lines, the upstream tanks and the ingredients themselves. No study has yet traced the full path of a particle from the field to the glass.
Is It Dangerous to Drink Those Microplastics?
The honest answer is that we do not know. The World Health Organization concluded in 2019 that, based on the available information, microplastics in drinking water do not appear to pose a health risk at current levels, and that particles larger than 150 microns are not absorbed by the body.
ANSES itself acknowledges that toxicological data are lacking to say whether the amounts found in beverages represent a risk. What does exist are intake estimates.
In Spain, the estimated daily intake from beverages was 0.077 particles per kilogram of body weight in children and 0.159 in adults. In Mexico, the highest values corresponded to canned soft drinks and water in glass, with 0.23 and 0.24 particles per kilogram per day.
In the United States, a person who drinks one beer of 355 milliliters a day ingests around 520 particles a year through that route. For comparison, the tap water in that same study contributed more than 4,000.
What Can a Brewery Do?
The measure with the best evidence is cleaning the caps before capping. Blowing and rinsing them cut particles by almost 70% in the French trial, a simple process change compared with the alternative of switching containers.
Choosing between bottle or can because of microplastics has no clean answer today. The can came out better in France and worse in Mexico, and in Spain every can showed resin from the coating.
For the consumer, the useful figure is the proportion. Drinking beer contributes a minor fraction of the microplastics we ingest each day, far below water, and no health agency has recommended cutting back on it for this reason.
Frequently Asked Questions (FAQ)
1. How Many Microplastics Does a Beer Contain?
It depends on the country and the measurement method. Published studies range from 4.05 particles per liter in the United States (2018) to 82.9 in France (2025) and 95.5 in Spain (2024). In Mexico (2026) the average was 20.6 particles per liter.
2. Does Canned Beer Have Fewer Microplastics Than Bottled Beer?
In the French ANSES study, beverages in glass had between 5 and 50 times more particles than in cans, because of the paint on the caps. In Mexico, canned soft drinks were the most contaminated item and in Spain every can showed resin from the coating, so there is no clearly clean container.
3. Where Do the Microplastics in Beer Come From?
The best-documented source is the exterior paint of the metal caps, which comes off through scuffing during storage. Filtration, filling lines, the interior coating of cans and the ingredients are also pointed to. Tap water was ruled out as the main source in the US study.
4. Is It Dangerous to Drink Beer With Microplastics?
There is no evidence of harm at the levels measured. The WHO concluded in 2019 that microplastics in drinking water do not appear to pose a health risk based on current data, and ANSES acknowledges that toxicological studies are lacking. Beer contributes a small fraction of total daily intake.
5. How Can a Brewery Reduce Microplastics?
Blowing and rinsing the caps before capping reduced contamination from 287.3 to 86.7 particles per liter in the ANSES trial, almost 70%. It is the only measure with a controlled trial behind it.
References
Chaïb, I., Doyen, P., Merveillie, P., Dehaut, A. and Duflos, G. (2025). Microplastic contaminations in a set of beverages sold in France. Journal of Food Composition and Analysis, 144, 107719. doi.org/10.1016/j.jfca.2025.107719
Muncke, J., Backhaus, T., Brander, S. M., Fini, J.-B., Gündoğdu, S., Schür, C., Zimmermann, L. and Scheringer, M. (2025). Comment on “Microplastic contaminations in a set of beverages sold in France” by Chaïb et al. Journal of Food Composition and Analysis, 148, 108310. doi.org/10.1016/j.jfca.2025.108310
Socas-Hernández, C., Miralles, P., González-Sálamo, J., Hernández-Borges, J. and Coscollà, C. (2024). Assessment of anthropogenic particles content in commercial beverages. Food Chemistry, 447, 139002. doi.org/10.1016/j.foodchem.2024.139002
Hernández-Covarrubias, C. M., Muñiz-Valencia, R., Membrila-González, J. et al. (2026). Machine learning-supported detection, FTIR characterization and estimated dietary intake of microplastics in bottled water and beverages in western Mexico. Physics and Chemistry of the Earth, 144, 104499. doi.org/10.1016/j.pce.2026.104499
Kosuth, M., Mason, S. A. and Wattenberg, E. V. (2018). Anthropogenic contamination of tap water, beer, and sea salt. PLOS ONE, 13(4), e0194970. doi.org/10.1371/journal.pone.0194970
Liebezeit, G. and Liebezeit, E. (2014). Synthetic particles as contaminants in German beers. Food Additives & Contaminants: Part A, 31(9), 1574-1578. doi.org/10.1080/19440049.2014.945099
Lachenmeier, D. W., Kocareva, J., Noack, D. and Kuballa, T. (2015). Microplastic identification in German beer, an artefact of laboratory contamination? Deutsche Lebensmittel-Rundschau, 111(10), 437-440. doi.org/10.5281/zenodo.1250714
Diaz-Basantes, M. F., Conesa, J. A. and Fullana, A. (2020). Microplastics in Honey, Beer, Milk and Refreshments in Ecuador as Emerging Contaminants. Sustainability, 12(14), 5514. doi.org/10.3390/su12145514
Bhowmik, A., Hossain, B. M. R. and Saha, G. (2026). Analytical Variability in Microplastic Quantification: A Narrative Review of Commercial Beverages. Pollutants, 6(3), 44. doi.org/10.3390/pollutants6030044
Alves, S., de Assis, B., Alves, A., dos Santos, J., Sá, F., Rocha, G. and Bom, F. (2025). What’s in Our Drinks? First Comparison of Microplastic Contamination in Industrialized Beverages in Brazil. SSRN preprint. doi.org/10.2139/ssrn.5255639
World Health Organization (2019). WHO calls for more research into microplastics and a crackdown on plastic pollution. Press release of 22 August 2019. who.int
ANSES (2025). Les capsules des bouteilles en verre contaminent les boissons avec des microplastiques. Press release of 20 June 2025. anses.fr

Recommended
- Why the wine and beer industry does not use plastic packaging
- Bottle or can for craft beer? 4 things to keep in mind